Clarksville TN Real Estate Market Update: June 2026
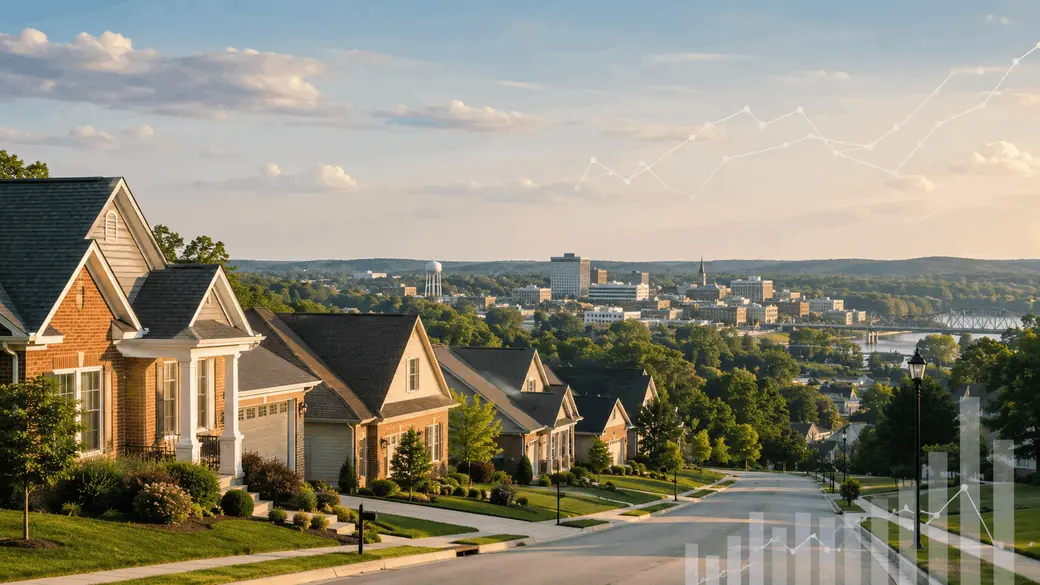
Clarksville and Montgomery County are not crashing. The June 2026 housing market is becoming more balanced, with buyers gaining more room to compare homes and sellers needing sharper pricing, preparation, and marketing.
Clarksville TN Real Estate Market Update: June 2026
Clarksville, Montgomery County, and Local ZIP Code Housing Trends
The Clarksville real estate market is not crashing. It is recalibrating.
That may not sound as dramatic as the headlines people like to click, but it is a much more accurate picture of what is happening in Clarksville and Montgomery County right now.
In June 2026, Montgomery County had fewer new listings, fewer closed sales, more homes going under contract, slightly mixed pricing, longer selling timelines, and more months of supply than last year. That combination points to a market where buyers have more breathing room, but sellers are not out of options.
The best word for this market is selective.
Buyers are still buying. Sellers are still selling. But the homes that perform best are usually priced well, prepared well, and marketed well from the start.
Quick Answer: Is Clarksville a Buyer’s Market or Seller’s Market?
Clarksville and Montgomery County are moving closer to a balanced market.
In June 2026, Montgomery County single-family homes had 4.6 months of supply, up from 3.98 months in June 2025. That does not mean buyers can make low offers on every home and expect success. It also does not mean sellers can price aggressively and expect buyers to chase the listing.
It means both sides need strategy.
Montgomery County June 2026 Market Snapshot
Here is the single-family residential market data for Montgomery County, TN.
| Metric | June 2025 | June 2026 | Year-Over-Year Change |
|---|---|---|---|
| New Listings | 821 | 622 | Down 24% |
| New Under Contract | 392 | 441 | Up 13% |
| Active Inventory Avg | 1,529 | 1,530 | Flat |
| Under Contract Inventory Avg | 751 | 688 | Down 8% |
| Total Inventory | 2,280 | 2,218 | Down 3% |
| Closings | 479 | 411 | Down 14% |
| Average Sale Price | $364,145 | $367,980 | Up 1% |
| Median Sale Price | $345,900 | $338,900 | Down 2% |
| Avg Days on Market | 33 | 37 | Up 15% |
| Avg Active List Price | $397,292 | $412,708 | Up 4% |
| List to Contract Avg | 52 days | 56 days | Up 8% |
| Contract to Closed Avg | 46 days | 48 days | Up 4% |
| List to Closed Avg | 93 days | 99 days | Up 7% |
| Months of Supply | 3.98 | 4.60 | Up 16% |
What the Montgomery County Numbers Really Mean
The biggest story is not one single number. It is the combination of several numbers moving in different directions.
New listings were down 24%, which means fewer sellers entered the market compared with last June. Closings were also down 14%, which shows that completed sales activity slowed.
But new under-contract activity was up 13%. That matters.
Buyers did not disappear. In fact, more homes went under contract in June 2026 than in June 2025. The market is still moving, but buyers are being more selective and closings are taking longer to show up in the final numbers.
The average sale price increased 1%, while the median sale price decreased 2%. That tells me prices are not falling evenly across the board. Instead, the market is becoming more property-specific. Some homes are still supporting strong prices, while others need better pricing, better condition, or more negotiation flexibility.
The Pricing Gap Sellers Need to Pay Attention To
One of the most important numbers in this report is the gap between the average active list price and the average sale price.
- Montgomery County average active list price: $412,708
- Montgomery County average sale price: $367,980
That does not mean every home is overpriced. Active listings and closed listings are not always the same type of inventory. Larger homes, newer homes, and higher-end homes can pull active list prices higher.
But it does show something sellers need to understand: buyers are not simply accepting every asking price.
If your home is listed above the range where similar homes are actually closing, buyers will notice. They may skip the home, wait for a price reduction, or use the data to negotiate.
In this market, pricing correctly from the beginning is not boring. It is strategic.
How Clarksville Compares to the National Market
Nationally, the housing market is also more balanced than it was during the ultra-competitive pandemic-era market.
The latest National Association of REALTORS® existing-home sales snapshot available as of July 1, 2026, showed May 2026 existing-home sales at 4.17 million, with a national median sales price of $429,300 and 4.5 months of inventory.
Montgomery County’s June 2026 months of supply was 4.6, which is very close to that national 4.5-month inventory level.
That is an important comparison. Clarksville is not behaving like an isolated problem market. It is following the broader trend toward balance, affordability pressure, and more careful buyer decision-making.
Mortgage Rates Are Still Controlling the Conversation
Mortgage rates remain one of the biggest reasons buyers are cautious.
Freddie Mac reported that the average 30-year fixed mortgage rate was 6.49% as of June 25, 2026, compared with 6.77% one year earlier. The 15-year fixed rate averaged 5.84%.
Rates are slightly better than last year, but they are still high enough to affect affordability. A buyer may like a home at $350,000, but the monthly payment still has to work.
That is why today’s buyers are paying close attention to interest rate, loan type, property taxes, homeowners insurance, HOA fees, closing costs, repairs, seller concessions, and rate buydown options.
For many buyers, the best deal is not always the lowest price. Sometimes the better move is a home with the right seller concession, better condition, or a lower out-of-pocket cost at closing.
Tennessee and Middle Tennessee Market Context
Statewide, Tennessee is also showing a steady but more measured market. Tennessee REALTORS® reported May 2026 market data showing sales up 3.7% year-over-year, listings nearly flat at 0.9%, median sales price up 1.3%, and months of inventory down 3.2%.
Greater Nashville REALTORS® reported April 2026 residential data for its nine-county Middle Tennessee report showing a residential median price of $503,340, residential inventory of 9,819, and days on market at 57. That report covers Davidson, Cheatham, Dickson, Maury, Robertson, Rutherford, Sumner, Williamson, and Wilson counties, not Montgomery County.
That comparison matters because Clarksville remains more affordable than much of the Greater Nashville market. For buyers comparing Clarksville to Nashville-area suburbs, Montgomery County can still offer a lower price point, more home for the money, and strong access to Fort Campbell.
Clarksville ZIP Code Breakdown: 37040, 37042, and 37043
Clarksville is not one single market. The ZIP code, price point, school zone, commute pattern, age of home, and neighborhood all matter.
Here is the combined June 2026 data for Clarksville’s main ZIP codes: 37040, 37042, and 37043.
| Metric | June 2025 | June 2026 | Year-Over-Year Change |
|---|---|---|---|
| New Listings | 771 | 597 | Down 23% |
| New Under Contract | 372 | 415 | Up 12% |
| Active Inventory Avg | 1,426 | 1,447 | Up 1% |
| Closings | 455 | 396 | Down 13% |
| Average Sale Price | $363,873 | $361,806 | Down 1% |
| Median Sale Price | $345,990 | $335,450 | Down 3% |
| Avg Days on Market | 32 | 37 | Up 15% |
| Avg Active List Price | $385,590 | $402,550 | Up 4% |
| Months of Supply | 3.89 | 4.51 | Up 16% |
The main Clarksville ZIP codes are showing a similar pattern to Montgomery County overall: fewer new listings, fewer closings, more pending activity, longer days on market, and slightly softer prices.
That is not a dead market. That is a market where buyers are comparing options more carefully.
37040 Housing Market: Central Clarksville and Surrounding Areas
| New Listings | 132 |
| New Under Contract | 104 |
| Active Inventory Avg | 343 |
| Closings | 108 |
| Average Sale Price | $341,162 |
| Median Sale Price | $318,700 |
| Avg Days on Market | 44 |
| Avg Active List Price | $367,374 |
| List to Closed Avg | 101 days |
| Months of Supply | 4.15 |
The 37040 market sits in the middle of the three major Clarksville ZIP codes by price. It had the longest average list-to-close timeline at 101 days and the highest average days on market for closed homes at 44 days.
For buyers, this may create opportunities to compare homes and negotiate when a property has been sitting.
For sellers, this means condition and price need to be aligned. Buyers have enough time to notice when a home feels overpriced compared with similar options.
37042 Housing Market: Fort Campbell Side and More Affordable Price Points
| New Listings | 268 |
| New Under Contract | 192 |
| Active Inventory Avg | 583 |
| Closings | 158 |
| Average Sale Price | $302,533 |
| Median Sale Price | $293,000 |
| Avg Days on Market | 38 |
| Avg Active List Price | $335,052 |
| List to Closed Avg | 94 days |
| Months of Supply | 4.57 |
The 37042 ZIP code had the most new listings, most active inventory, and most closings among the three main Clarksville ZIP codes.
It also had the lowest average and median sale price.
That makes 37042 especially important for Fort Campbell buyers, VA buyers, first-time buyers, and renters considering homeownership. There is more activity here, but there is also more competition among listings.
For sellers, standing out matters. Photos, price, repairs, showing access, and marketing all carry more weight when buyers have several options.
For buyers, 37042 may offer more choices, but the best homes can still move quickly when they are priced well.
37043 Housing Market: Higher Price Points, Sango, Exit 11, and Move-Up Buyers
| New Listings | 197 |
| New Under Contract | 119 |
| Active Inventory Avg | 520 |
| Closings | 130 |
| Average Sale Price | $450,996 |
| Median Sale Price | $419,995 |
| Avg Days on Market | 31 |
| Avg Active List Price | $506,832 |
| List to Closed Avg | 97 days |
| Months of Supply | 4.73 |
The 37043 ZIP code remains Clarksville’s highest-priced major ZIP code in this report.
It had the highest average sale price, highest median sale price, and highest average active list price. It also had the lowest average days on market for closed homes at 31 days.
That may sound surprising because 37043 also had the highest months of supply at 4.73. Here is what that likely means: the better-positioned homes are still moving, while overpriced or less competitive homes are giving buyers more choices.
For sellers in Sango, Exit 11, Rossview, and nearby higher-price areas, this is a reminder that demand still exists, but buyers are more selective at higher monthly payments.
Are Home Prices Dropping in Clarksville TN?
Some prices are softening, but the market is not showing a broad collapse.
In Montgomery County, the average sale price increased 1% year-over-year, from $364,145 in June 2025 to $367,980 in June 2026. The median sale price decreased 2%, from $345,900 to $338,900.
In the combined 37040, 37042, and 37043 ZIP codes, the average sale price decreased 1%, and the median sale price decreased 3%.
That means the answer depends on the home.
An updated home in a desirable location with a realistic price can still perform well. A home with deferred maintenance, weak presentation, or an aggressive asking price may need more time or negotiation.
The market is not punishing every seller. It is punishing guesswork.
What Buyers Can Negotiate Right Now
Buyers may have more negotiating room than they had a few years ago, especially when a home has been on the market longer, has obvious repair needs, or is priced above recent comparable sales.
Common negotiation points may include:
- Purchase price
- Closing cost assistance
- Rate buydown contributions
- Repairs after inspection
- Home warranty
- Appraisal gap strategy
- Closing timeline
- Occupancy terms
The key is knowing when to negotiate and when to move quickly.
A home that has been sitting for 45 days may require a different offer strategy than a clean, well-priced home that just hit the market in a popular neighborhood.
What Sellers Should Do Before Listing
Sellers need to prepare for a market where buyers compare everything.
Before listing, focus on:
- Accurate pricing based on recent comparable sales
- Clean, bright photos
- Curb appeal
- Small repairs
- Paint where needed
- Flooring condition
- Odor control
- Decluttering
- Easy showing access
- Clear marketing that explains the home’s value
The goal is not just to list the home. The goal is to make the home easy for buyers to choose.
In this market, the first impression matters because buyers have more choices than they did during the fastest seller-market years.
Should Sellers Reduce Price or Offer Concessions?
It depends on the situation.
A price reduction may help if the home is clearly overpriced compared with similar closed sales or active competition.
A seller concession may help if the price is reasonable but buyers are struggling with cash to close or monthly payment comfort.
For example, a buyer may care more about closing cost help or a rate buydown than a small price reduction. That is especially true for first-time buyers, FHA buyers, VA buyers, and buyers trying to preserve savings after closing.
The right strategy depends on the property, the buyer pool, the days on market, the competition, and the seller’s timeline.
What This Means for Fort Campbell and Relocation Buyers
For Fort Campbell and relocation buyers, the June 2026 market may be easier to navigate than the ultra-competitive market from a few years ago.
More balanced inventory gives buyers more room to compare homes, consider commute routes, and avoid rushing into the wrong property. But relocation buyers still need to be prepared because the best homes can move quickly.
If you are PCSing to Fort Campbell or relocating to Clarksville, pay attention to commute time, gate access, school zones if applicable, monthly payment, neighborhood resale potential, new construction versus resale, inspection results, closing timeline, and temporary housing needs.
A good relocation strategy is not just about finding a house. It is about matching the home, timeline, payment, and move-in plan.
What About New Construction in Clarksville?
New construction remains an important part of the Clarksville market.
Builder inventory can create opportunities for buyers, especially when builders offer incentives such as closing cost assistance, rate buydowns, or preferred-lender packages.
But buyers should compare the full picture, not just the advertised price.
When comparing new construction and resale, look at builder incentives, interest rate options, lot premiums, HOA fees, included features, appliance packages, window coverings, fence costs, landscaping, builder warranty, timeline to completion, and nearby resale competition.
New construction can be a great fit, but it should still be compared against resale homes with real numbers.
My Take on the June 2026 Clarksville Market
This is a market where advice matters again.
Buyers need more than a home search link. They need help comparing price, payment, location, condition, and negotiation opportunity.
Sellers need more than a sign in the yard. They need pricing strategy, preparation, marketing, and honest feedback about what buyers are seeing.
The Clarksville and Montgomery County market is still active. It is just not automatic.
A well-priced home can still sell. A prepared buyer can still find opportunity. But both sides need to understand the current market instead of relying on memories from 2021, 2022, or even last year.
Frequently Asked Questions About the Clarksville TN Real Estate Market
Is the Clarksville housing market crashing?
No. Based on the June 2026 local data, Clarksville and Montgomery County are not showing a crash. The market is more balanced, homes are taking longer to sell, and prices are mixed, but buyers are still putting homes under contract.
Is Clarksville a buyer’s market?
Clarksville is closer to balanced than it has been in recent years. Buyers have more room to compare and negotiate, but well-priced homes can still attract strong interest.
Are home prices going down in Montgomery County TN?
Median prices are slightly lower year-over-year, while average prices are slightly higher. In June 2026, Montgomery County’s average sale price was up 1%, while the median sale price was down 2%.
How long does it take to sell a house in Clarksville?
For Montgomery County single-family homes that closed in June 2026, the average days on market was 37 days. The average list-to-close timeline was 99 days.
Which Clarksville ZIP code is most affordable?
Based on the June 2026 data, 37042 had the lowest average sale price at $302,533 and the lowest median sale price at $293,000.
Which Clarksville ZIP code is most expensive?
Based on the June 2026 data, 37043 had the highest average sale price at $450,996 and the highest median sale price at $419,995.
What does months of supply mean?
Months of supply estimates how long it would take to sell the current inventory if no new listings came on the market. Montgomery County had 4.6 months of supply in June 2026, which points toward a more balanced market.
Should I buy now or wait?
That depends on your payment comfort, timeline, job stability, savings, and long-term plans. Waiting for rates to fall may help if they actually drop, but waiting can also mean different prices, different inventory, or more competition.
Should I sell my Clarksville home now?
Selling can still make sense, but pricing and preparation are more important than they were during the fastest seller-market years. The homes that perform best are usually priced correctly and presented well from day one.
Are sellers offering closing costs in Clarksville?
Some sellers may be open to concessions depending on the property, price, days on market, and competition. Seller concessions are not guaranteed, but they are worth discussing in a more balanced market.
Helpful Clarksville Real Estate Resources
- Search Clarksville homes for sale
- Clarksville home buying guide
- Sell your home in Clarksville
- Clarksville sellers guide
- Recently sold homes
- New construction homes in Clarksville
- Clarksville rental guide
Sources and References
- Local June 2026 market data reviewed for residential single-family homes in Montgomery County, TN and Clarksville ZIP codes 37040, 37042, and 37043.
- National Association of REALTORS® Existing-Home Sales Data
- Freddie Mac Primary Mortgage Market Survey
- Tennessee REALTORS® Market Data
- Realtor.com May 2026 Monthly Housing Report
- Greater Nashville REALTORS® Monthly Home Sales Report
Categories
- All Blogs 52
- Clarksville Montgomery County Market Updates 12
- Community Events and Local News 9
- First Time Homebuyer Resources 19
- Holidays at Home 4
- Home Buying Tips 27
- Home Improvement and Maintenance 6
- Home Selling Tips 11
- Military and PCS Moves 4
- Mortgage and Financing 2
- Moving to Clarksville 5
- Neighborhood Guides 10
- Real Estate Glossary and FAQs 8
- Real Estate Investing 2
- Renter's Resources 5
- Style and Design 3
Recent Posts